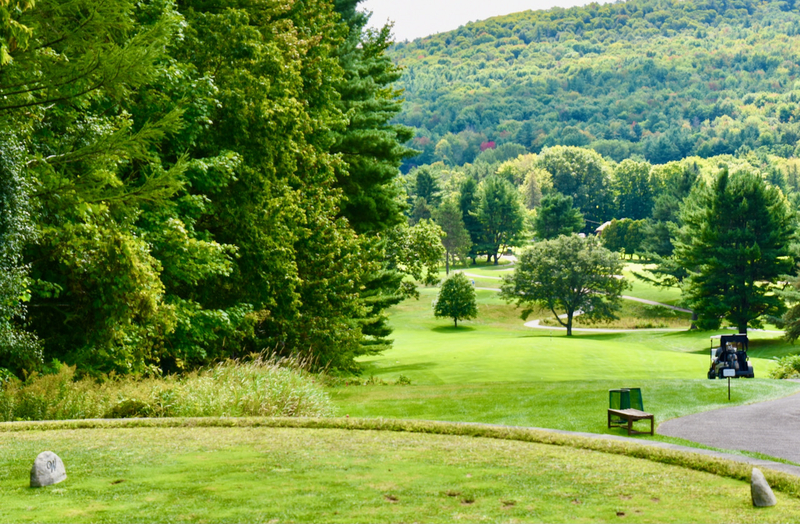
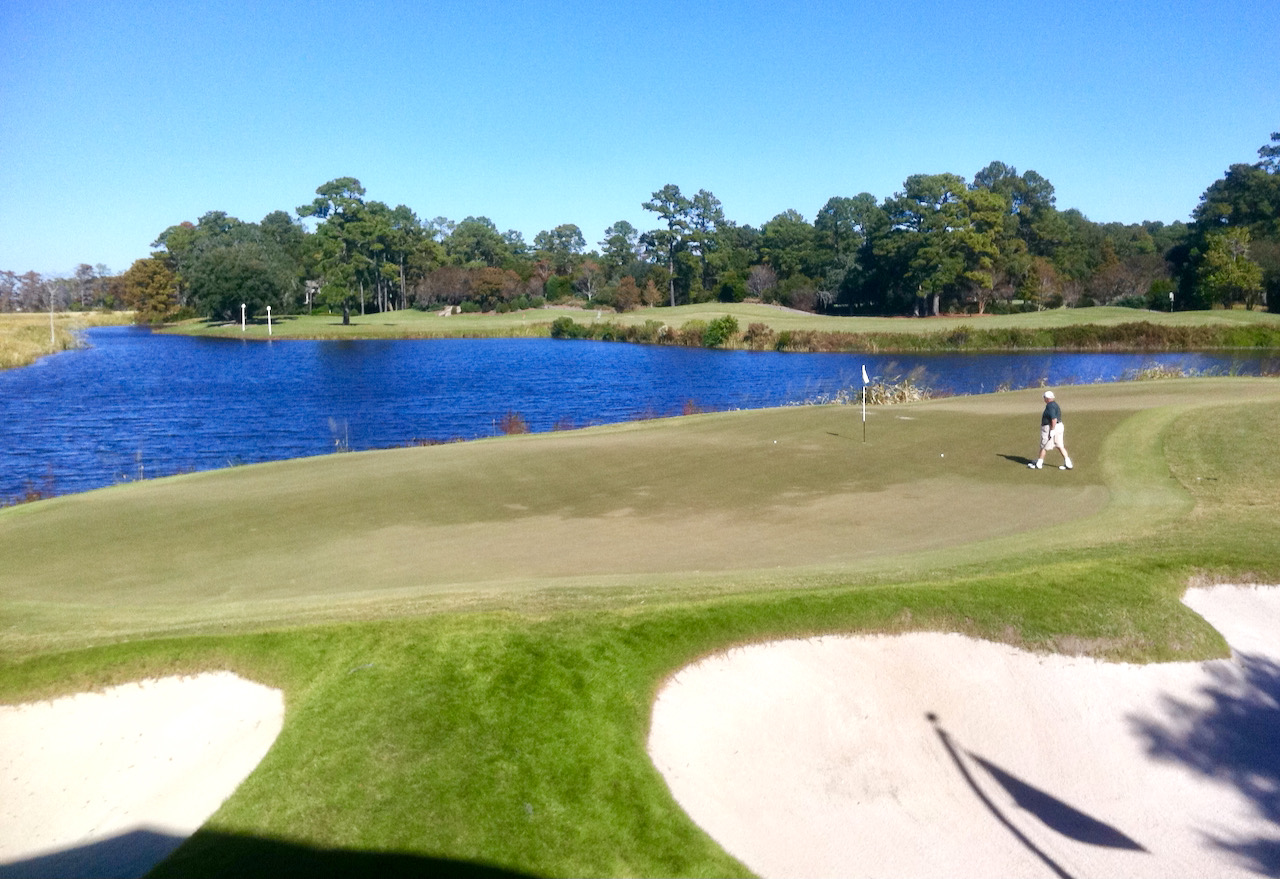
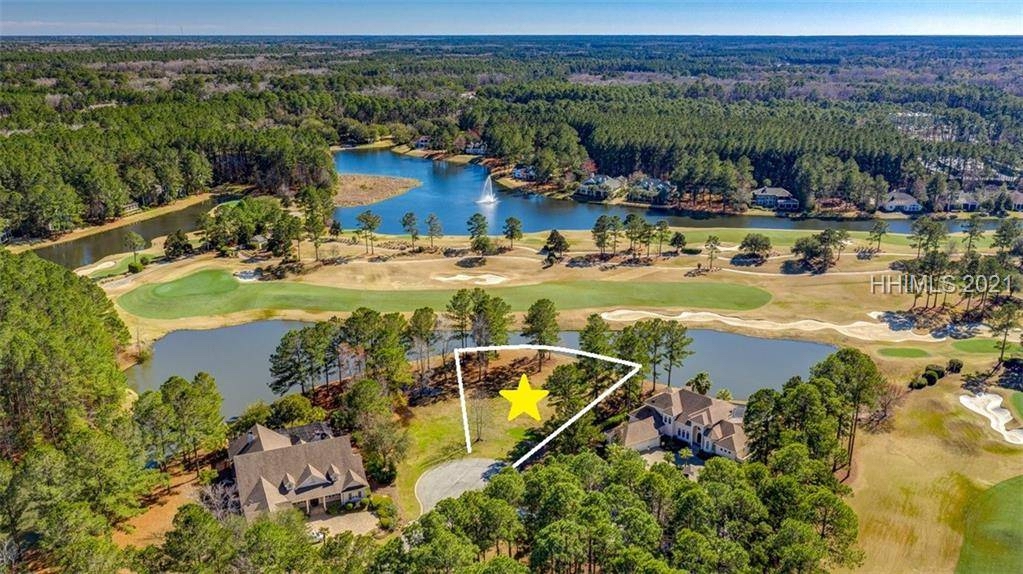
The Reserve at Litchfield Beach is one of three private courses on the South Strand of Myrtle Beach.
On my first visit to Myrtle Beach in 1971, a college friend and I paid $99 each for an oceanfront room and the golf package at the Travelodge. That's $99 for a week, not per night. Included were 18 holes of golf with cart per day, a hot breakfast every morning, two-dozen golf balls each, and free beer and an oyster roast from 5 to 7 p.m. Okay, so we only had a choice of about 25 golf courses to play, but we didn't think we could manage more than a dozen during the week anyway (we were young and up for 36 holes a day).
For years, Myrtle Beach has been the Wal-Mart of golf, cheap and without the pretensions of Pinehurst and Kiawah Island. Myrtle Beach was the triumph of quantity over quality; during the ‘70s and ‘80s, hardly a year went by without a dozen new courses opening along the Grand Strand, which stretches essentially 90 miles
Myrtle Beach golf began to hit the skids in the late 1990s as the numbers of visiting golfers leveled off but the competition among the excessive number of courses didn't. Faced with the increasing costs to spiff up their courses, some course owners got weak in the knees when developers offered profits to replace out of control
 expenses. Clubs like Bay Tree Plantation and Deer Track sold out to housing developers, causing much gnashing of teeth at Myrtle Beach Golf Holiday, the Strand's most effective promoter, and among all the hotels that counted on golfers in the cool weather seasons of early spring and fall.
But as a forest fire promotes re-growth, the loss of more than a dozen courses has actually made the remaining courses stronger and set the stage for an image change. The laws of supply and demand have taken over. Fewer courses, the same or more players, and the confidence among survivors that they can invest in their courses with impunity has led to something of a renaissance among the Strand's courses, as well as a notion that Myrtle Beach - at least as far as golf is concerned - is not synonymous with tacky. The Strand hasn't gotten its groove back, it has discovered it.
Publications like Golf Digest have helped. No fewer than 10 of the top 100 golf courses in its latest ratings of "courses you can play" are located in the Myrtle Beach area. Reader/reviewers for Zagat's survey of America's top daily fee courses gave Caledonia Golf & Fish Club in Pawleys Island a rating of 29 in the latest guide; only the other-worldly Bandon Dunes in Oregon and Whistling Straits in Wisconsin earned a perfect 30. The Tidewater Golf Club, at the opposite (northern) end of the Strand, earned a 27.
The historically proletarian Myrtle Beach golf scene is turning a bit more Patrician. One of the better "package" courses, the Surf Club in North Myrtle Beach, successfully went members-only five years ago. Two years ago, Grande Dunes, a golf and beach resort community with homes in the seven-figure range, added the Members
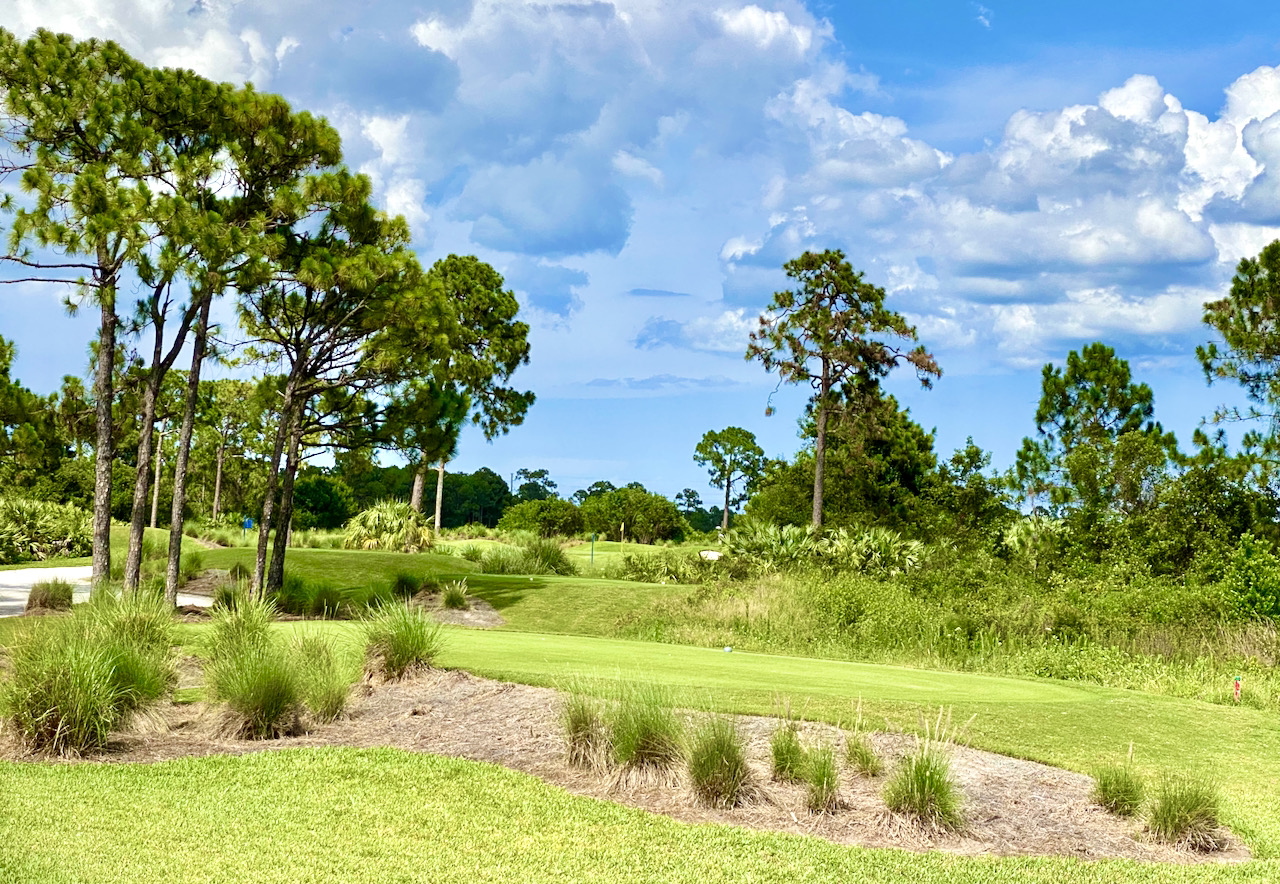
At the southern end of the Strand, DeBordieu (Pete Dye), The Reserve (Greg Norman) and Wachesaw Plantation (Tom Fazio) form a triumvirate of outstanding private courses. In the spirit of cooperation and marketing, high-quality daily-fee courses, including Caledonia and its brother course, True Blue, have formed the Waccamaw Golf Trail; the Trail's courses are within just a few mintues of each other far away from the neon tackiness and, ahem, gentlemen's bars of Myrtle Beach proper. The roster of the 12 Waccamaw courses includes Pawleys Plantation, which is both a members and resort access course by Jack Nicklaus; the Founders Club, an impressive looking layout by Thomas Walker that opens next month; the live oak draped Heritage Golf Club; and the TPC of Myrtle Beach. In high season, green fees approach $200 at Caledonia.
It is still too early to predict whether Myrtle Beach can throw off the shackles of its reputation as a blue-collar golf destination, but its standing in the latest Golf Digest magazine and word of mouth are giving the golf courses in the area more street cred. For a short and interesting discussion about Myrtle Beach's new direction, click here for a podcast produced by Travel Golf.

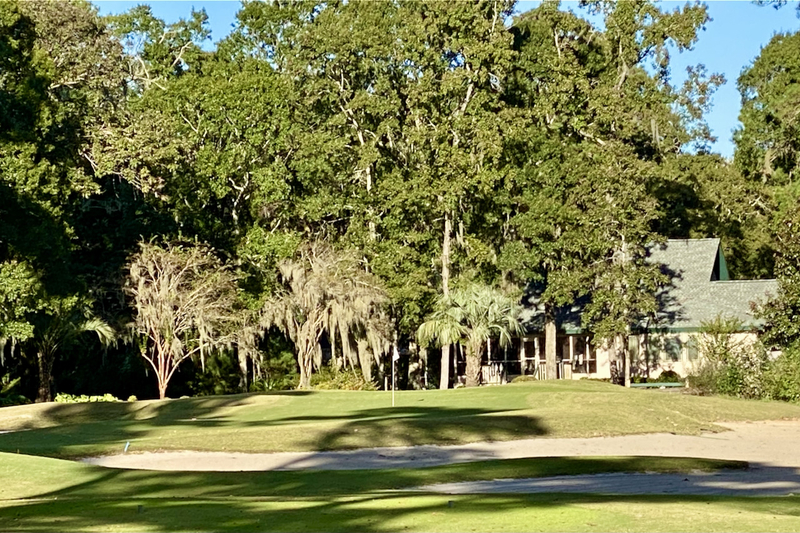
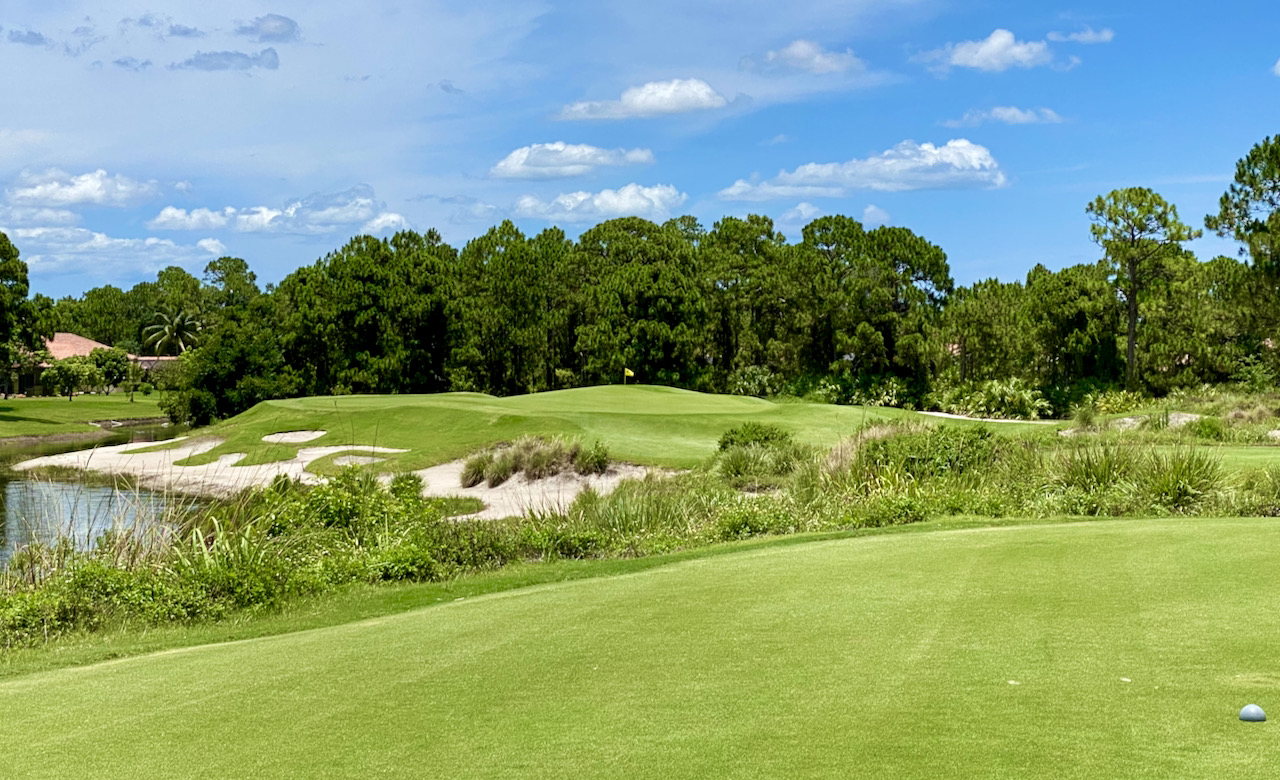
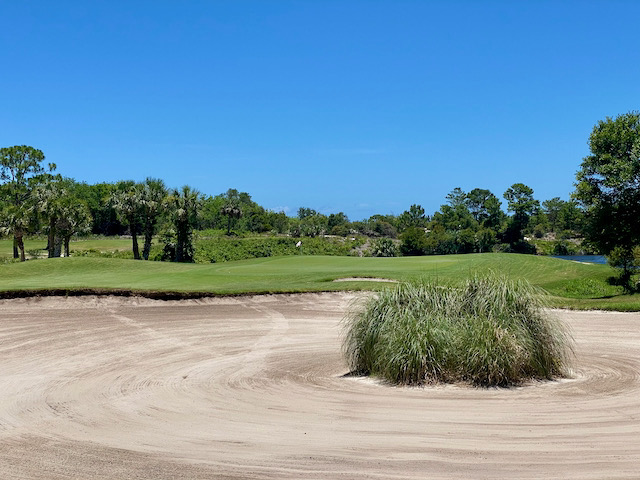
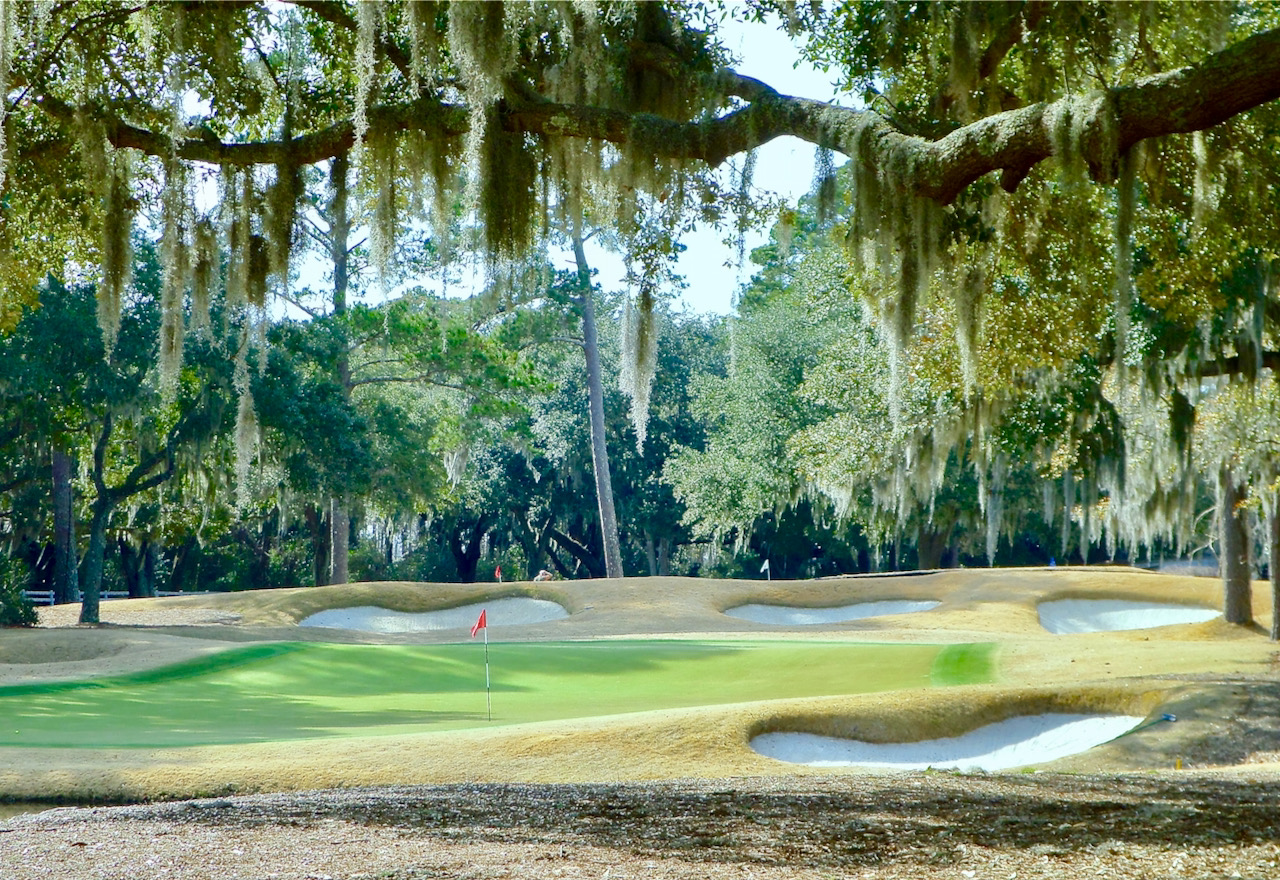
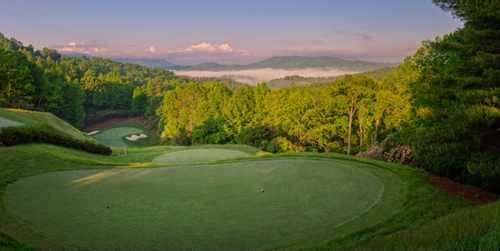
Caledonia is the late Mike Strantz's least affected, but most beloved course. It anchors the 12 course Waccamaw Golf Trail on the southern end of the Grand Strand. Above is the par three 12th hole.